Bingo Odds & Probability: What Are Your Real Chances of Winning? (2026)
How often do you actually win at bingo? Most players have a vague sense that they win “sometimes” — but few have looked at the actual mathematics.
Understanding the probability behind bingo isn’t just academic. It shapes how you should think about bankroll, session length, stakes selection, and — most critically — whether a bingo app is genuinely skill-based or just luck with extra steps.
Let’s do the math.
Table of Contents
- Basic Bingo Probability: The Fundamentals
- How Many Balls to Complete a Pattern?
- Odds by Number of Players
- Odds by Number of Cards You Hold
- Pattern Probability: Easier vs. Harder Wins
- How Skill Changes the Probability Equation
- Expected Value: The Real Financial Picture
- Practical Implications for Bingo Gold Cash Players
- Frequently Asked Questions
Basic Bingo Probability: The Fundamentals
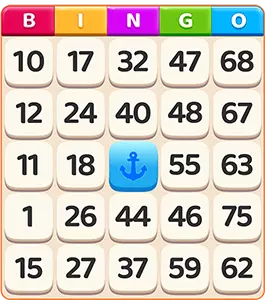
A standard 75-ball bingo game uses:
- 75 numbered balls (B1–B15, I16–I30, N31–N45, G46–G60, O61–O75)
- 24 active squares per card (plus 1 free center square)
- Each player’s card has a fixed arrangement of numbers
The mathematical basis: if you hold 1 card and 1 other player holds 1 card, you each have a 50% chance of winning before any skill enters the picture. That’s the symmetry of pure luck-based bingo.
But bingo games rarely involve just 2 players — and many real-money apps add skill layers that fundamentally alter this calculation.
How Many Balls to Complete a Pattern?
One of the most common probability questions: how many balls need to be called before someone wins?
For a standard 5-in-a-row (single line) in 75-ball bingo:
| Balls Called | Probability at Least One Player Has a Line |
|---|---|
| 20 balls | Very low (~5-15% with many cards in play) |
| 30 balls | Moderate (~25-40%) |
| 43 balls | ~50% — median game length for a single line |
| 55 balls | ~80%+ — most games resolved by here |
| 75 balls | 100% — someone always wins eventually |
The median completion point for a single bingo is roughly 43 balls in a competitive game with multiple players. Full cards take significantly longer — the median for a Full House (all 24 squares) is typically 60–70 balls.
What This Means for Speed Scoring
In a 90-second game where roughly 30–50 balls might be called, the competition is intense and compressed. Every daub in those first 30 balls carries more weight — patterns are forming simultaneously across all players.
Odds by Number of Players
In traditional (luck-based) bingo:
| Players in Game | Your Win Odds (1 card each) |
|---|---|
| 2 players | 50.0% |
| 5 players | 20.0% |
| 10 players | 10.0% |
| 25 players | 4.0% |
| 50 players | 2.0% |
| 100 players | 1.0% |
This is the simple probability in a pure-luck game. But this model breaks down the moment skill is introduced — because skilled players don’t win at their “fair share” rate. They win at higher rates.
The Skill Multiplier
In a game where all players hold identical cards and outcomes depend on reaction speed and strategy, a player who performs in the top 20% of skill doesn’t win 20% of games — they win at a rate meaningfully higher than 20% because they consistently outperform lower-skilled players in the pool.
This is the core mathematical argument for why skill-based bingo is a genuine competitive format, not a lottery.
Odds by Number of Cards You Hold
In traditional multi-card bingo (where holding more cards is allowed and each has a different number set):
| Cards Held | Other Players’ Cards | Your Win Probability |
|---|---|---|
| 1 | 9 (10 cards total) | 10% |
| 2 | 8 | 20% |
| 4 | 6 | 40% |
| 6 | 4 | 60% |
More cards = proportionally higher odds. This is why experienced traditional bingo players often manage multiple cards simultaneously.
How This Applies in Skill Bingo Apps
In apps like Bingo Gold Cash, each player typically manages one card — but all cards are identical. Holding “more cards” isn’t the mechanism for better odds. Instead, executing faster and more accurately on one card is the equivalent advantage.
Pattern Probability: Easier vs. Harder Wins
Different bingo patterns have dramatically different probability profiles:
75-Ball Patterns — Comparative Difficulty
| Pattern | Squares Needed | Relative Difficulty | Avg. Balls to Completion |
|---|---|---|---|
| Any Single Line (row/column/diagonal) | 5 | ⭐ Easiest | ~30–43 balls |
| Four Corners | 4 | ⭐⭐ Easy | ~35–50 balls |
| Two Lines (cross/T-shape) | 9–10 | ⭐⭐⭐ Moderate | ~45–55 balls |
| Frame/Border | 16 | ⭐⭐⭐⭐ Hard | ~55–65 balls |
| Full House (all 24 squares) | 24 | ⭐⭐⭐⭐⭐ Hardest | ~65–75 balls |
Bingo Gold Cash’s 4-Pattern System
Bingo Gold Cash awards 1,000 points each for these patterns (within a single match):
- 5 Horizontal Lines
- 5 Vertical Lines
- 2 Diagonal Lines
- 4 Corners
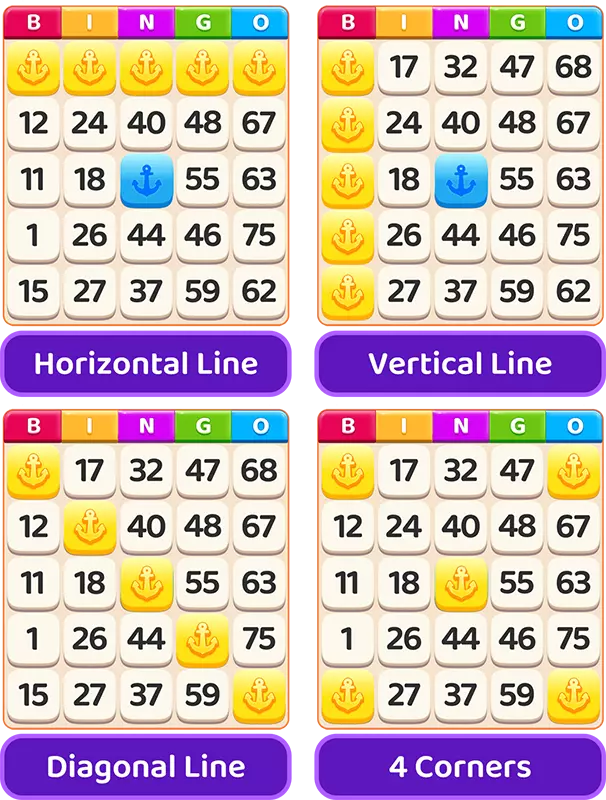
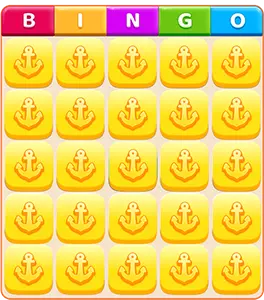
Plus 10,000 points for Full House.
Critically, multiple patterns can be completed within a single game. The structure rewards players who cover multiple patterns simultaneously rather than chasing only one. A player who plans their daub sequence to build toward multiple patterns will score higher than one focused on a single line.
This is strategic probability — understanding which patterns share the most squares and planning for maximum overlap:
| Pattern Pair | Squares Shared | Strategic Value |
|---|---|---|
| Horizontal + Vertical | High overlap | Cover both efficiently |
| Diagonal + 4 Corners | Moderate overlap | Corner squares serve both |
| All patterns + Full House | Maximum overlap | Every daub contributes |
How Skill Changes the Probability Equation
In traditional luck-based bingo, probability is fixed by math — the number of players and cards determines your odds.
In skill-based bingo, probability is modified by performance. Here’s a model:
Theoretical Win Rate Model
Assume a 10-player tournament. In a pure luck game, each player wins 10% of the time. Now introduce skill:
| Skill Level | Luck-Based Win Rate | Skill-Based Win Rate (Estimated) |
|---|---|---|
| Bottom 20% (weakest) | 10% | ~3–5% |
| Average | 10% | ~8–10% |
| Top 20% | 10% | ~20–25% |
| Top 5% (expert) | 10% | ~30–40% |
These estimates are based on general skill-gaming research models, not Bingo Gold Cash’s internal data. But the principle is consistent: skill polarizes outcomes. The distribution of wins is no longer uniform — it skews heavily toward better performers.
Speed Scoring: The Probability Amplifier
Bingo Gold Cash’s 100–140 points per daub scoring creates a compounding skill advantage:
- Player A (expert): Averages 135 pts/daub × 24 daubs = 3,240 speed points
- Player B (average): Averages 112 pts/daub × 24 daubs = 2,688 speed points
- Difference: 552 points — more than half the value of a completed pattern (1,000 pts)
This means an expert player can overcome the disadvantage of completing one fewer pattern through consistent speed alone. Skill genuinely changes outcomes in statistically meaningful ways.

Expected Value: The Real Financial Picture
Expected Value (EV) is the mathematical concept of how much you expect to gain or lose per game, on average.
EV Formula for a Bingo Tournament
EV = (Win Probability × Prize) - (Loss Probability × Entry Fee)
Example: $1.00 Entry Tournament (10 players)
Assume the platform takes a 15% rake:
- Total prize pool = $1.00×10×(100%-15%) = $8.50
- First place gets $8.50
For an average player (wins 10% of the time):
EV = (10% × $8.50) - (90% × $1.00) = $0.85 - $0.90 = -$0.05 per game
The average player loses $0.05 per game — or about 5 cents per dollar wagered. That’s the cost of entertainment plus the house edge.
For a top-tier player (wins 30% of the time):
EV = (30% × $8.50) - (70% × $1.00) = $2.55 - $0.70 = +$1.85 per game
A top-tier player makes $1.85 per dollar bet — a positive expected value.
Key Insight
The same mathematical structure that makes the average player lose slightly makes expert players profitable. This is why skill matters so much in tournament-format skill gaming: you’re not fighting the house, you’re fighting other players.

Practical Implications for Bingo Gold Cash Players
Understanding these probabilities has direct practical applications:
1. Start at Low Stakes Until You Know Your Skill Level
You don’t know your true win rate until you have a sample size. Play free games or $0.25 tournaments until you have at least 50 games to evaluate your performance. If you’re consistently in the bottom half of scores, moving to higher stakes won’t fix the problem.
2. Improve Speed to Change Your Odds
Your daub speed is directly within your control and has a mathematical impact on outcomes. Every 5-point improvement in average speed score adds real points per game. Time spent practicing your daub speed is time spent improving your win probability.
3. Tournament Size Matters
Smaller tournaments (3–5 players) have higher per-win value but lower probability of winning. Larger tournaments (20+ players) have smaller prize shares but more opportunities to leverage skill advantage over weaker players. Your optimal tournament size depends on your confidence in your skill level relative to the field.
4. The Free Space Is Your Friend
The free center square in 5×5 bingo effectively gives you a head start on patterns involving the center column/row and both diagonals simultaneously. Patterns that run through N33 (the free square column) are statistically easier to complete — prioritize them when possible.
5. Don’t Chase Losses with Higher Stakes
If you’re losing at 1tournaments,movingto5 tournaments doesn’t improve your odds — it amplifies your losses. The mathematical relationship between your skill level and EV doesn’t change with stakes. Fix your skill first, then raise stakes.
Frequently Asked Questions
Q: What are my chances of winning a single game of bingo?
A: In a 10-player game with equal skill levels, approximately 10%. In a skill-based game, your odds are a function of your skill relative to other players — better players win more than 10%, weaker players win less.
Q: Does buying more cards improve my bingo odds?
A: In traditional multi-card bingo, yes — proportionally to cards held. In skill bingo apps like Bingo Gold Cash where all players use one identical card, “more cards” isn’t the variable — performance is.
Q: Is there a mathematical strategy to win at bingo?
A: In traditional luck-based bingo, no strategy changes your odds — outcomes are fixed. In skill-based bingo, improving your reaction speed, optimizing power-up deployment, and understanding pattern probability genuinely improves your mathematical win rate.
Q: What’s the average payout rate for skill bingo apps?
A: Most skill gaming tournaments pay back approximately 80–90% of entry fees to players (the remainder is the platform rake). This compares favorably to slot machines (85–98% RTP) but the difference is that skilled players get more than their “fair share” while weaker players get less.
Q: How many games does it take to know if I’m profitable?
A: Statistical significance in bingo requires a meaningful sample. Consider 50–100 games your minimum sample for a preliminary skill assessment, and 200–500 games for a reliable read on your true win rate. Short-term variance can be significant.
Q: Can I calculate my exact win probability before a tournament?
A: You can estimate it. If you know the number of players, the entry fee, the prize structure, and your win rate from past tournaments, you can calculate your expected value using the formula above. Most players don’t track this level of data, but serious players benefit from doing so.
Summary: Bingo Odds at a Glance
| Scenario | Win Probability |
|---|---|
| 2-player game (equal skill) | 50% |
| 10-player game (equal skill) | 10% |
| 10-player game (top 20% skill) | ~20–25% |
| 10-player game (top 5% skill) | ~30–40% |
| Traditional bingo (luck only) | Fixed by math |
| Skill bingo (performance-based) | Modified by your skill level |
The math is clear: in skill-based bingo, you’re not at the mercy of probability. You can influence your odds through practice, strategy, and performance. That’s what makes skill gaming fundamentally different from traditional gambling — and why understanding the math makes you a better player.
[Download Bingo Gold Cash — Put Your Skill to the Test]
Related Articles: